Futures Trading Introduction
It is very important to understand the futures market not only because of its impact on supply and trading operations, but also because of its impact on wholesale product prices.
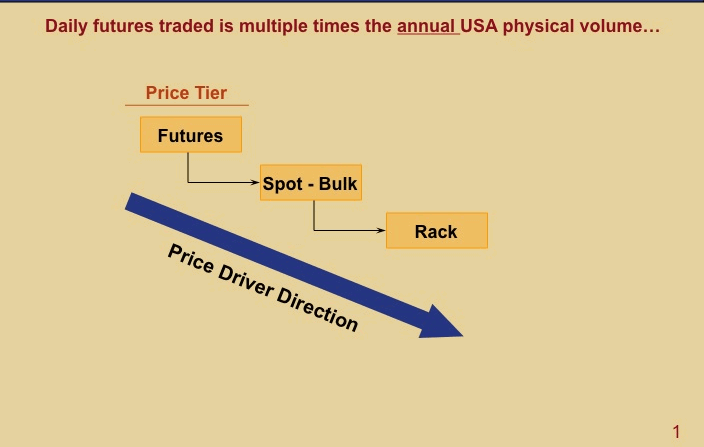
As shown by the blue arrow in the diagram, wholesale pricing is first driven by perceptions of future price from the futures markets, such as NYMEX and ICE. Petroleum prices respond to changes in supply and demand, not to changes in the cost of manufacturing or distribution.
Wholesale pricing generally takes one of two forms:
- The bulk price is the price paid for purchases of 40,000 gallons or more. Generally, these are based on spot (auction) prices at a specific producing or import center.
- The rack price is the daily posted price paid for a tanker truck load of product at a refiner’s loading rack, i.e., 8,000 to 9,000 gallons. Rack prices are based on spot prices but with a premium added for smaller loads.
The reason for this dominance, is that every day thousands of NYMEX and ICE market participants can trade contracts that equal multiple times the annual global refined product volumes actually sold.
Effective Hedging of Financial Risk in Oil and Gas
The Morning Meeting
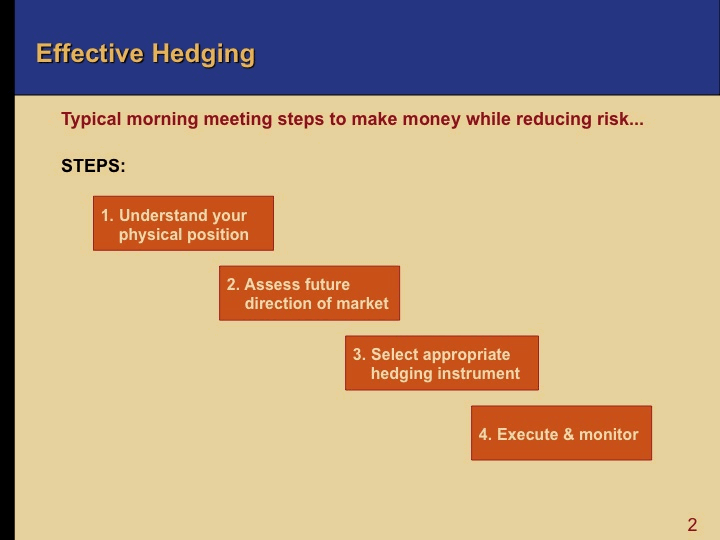
The easiest way to understand the key processes in supply and trading is to follow what happens in a typical morning supply meeting. The key decisions made at the meeting which are summarized in the chart, and each step in the chart will be covered in this lesson.
Most S&T operating groups meet before the NYMEX opens for business. Even with all the electronic exchanges, most trading activity around the world occurs when the New York NYMEX floor is open – from 9:00 a.m. – 2:30 p.m. EST.
With prevalent industry volatility “Every day is a new deal.” The logic used yesterday to make decisions is no longer valid or important.
At a morning supply meeting:
1. Individual supply network participants first review the physical impact of decisions made the day before (i.e., what actually happened) to ensure there is accuracy and visibility on inventory and commitments at all supply points. In the end, a determination is made on whether each supply point is long or short.
2. Next, the future direction of the market is debated at length. The most difficult judgment and risky part of the morning is to assess where the market is heading, not where it’s been.
3. The direction chosen affects the hedging strategy and the instrument(s) used to offset risk.
4. Once selected, the instrument is executed:
- either directly on an exchange or electronic forum,
- most often, through a broker-dealer or
- with a larger counterparty for longer term, non-standard arrangements – often called structured deals.
At the end of the day, the value and applicability of the current hedging instruments are reviewed with the trader by the risk manager in charge of that trader’s book.
The next morning, it starts all over again and adjustments are made as needed.
The Physical Oil and Gas Market
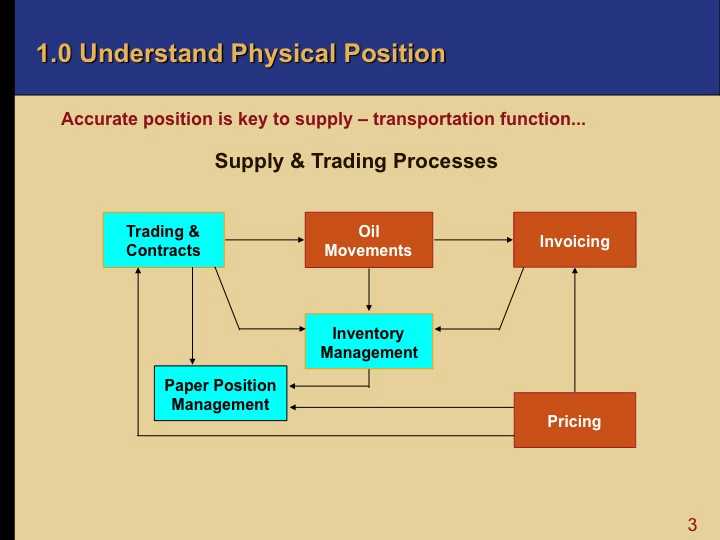
As the chart shows, all of the processes and day-to-day decisions in a supply trading function ultimately get reflected in the operating inventory levels.
Inventory level accuracy is also affected by the information systems used by the oil company or trader. For example, some systems do not adjust inventory until an invoice is generated. This process needs to be clearly understood by all traders and schedulers.
Inventory is the first item reviewed in the morning supply meeting, because inventory levels are the most important indicators of both physical position and balance around a supply network.
As the chart indicates, the data on the physical system must be routinely matched with the paper hedge positions to effectively measure and control any risk in the operation.
Inventory – Days of Supply
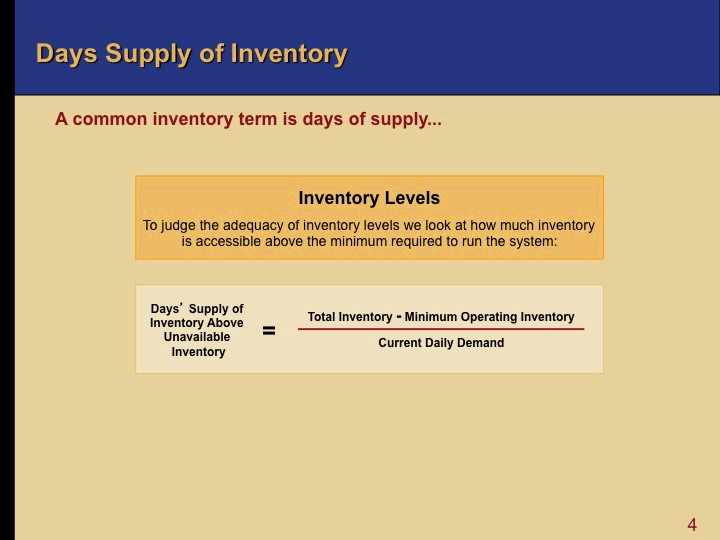
To judge the adequacy of inventory levels a supply and trading function first looks at how much inventory is accessible above the minimum required to run the system.
A very common term used to measure inventory levels in Supply and Trading is called days’ supply, which is calculated as shown in the chart:
Days’ Supply of Inventory Above Unavailable Inventory = Total Inventory – Minimum Operating Inventory / Current Daily Demand
Assessing Future Market Direction
The next process step in the morning supply meeting is to assess the future market direction.
One way to assess market direction is to examine the relationship between a commodity’s forward or futures price and its price for immediate delivery, or prompt price. This is not a forecast, but can say much about market conditions.
Contango
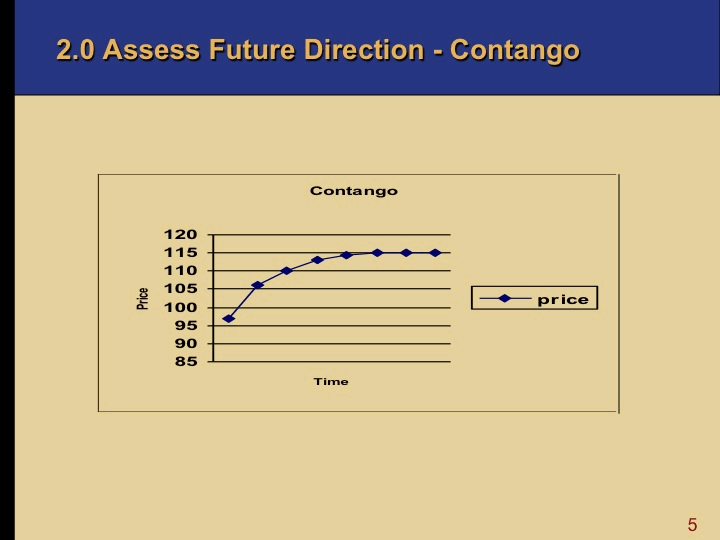
As the chart shows, in a market called pure contango, each succeeding month’s futures price exceeds its predecessor and the near-month futures price exceeds the spot price for the same commodity.
Contango is normal for a non-perishable commodity, like crude, and products which have a cost of carry. Such costs include warehousing fees and interest forgone on money tied up.
Backwardation
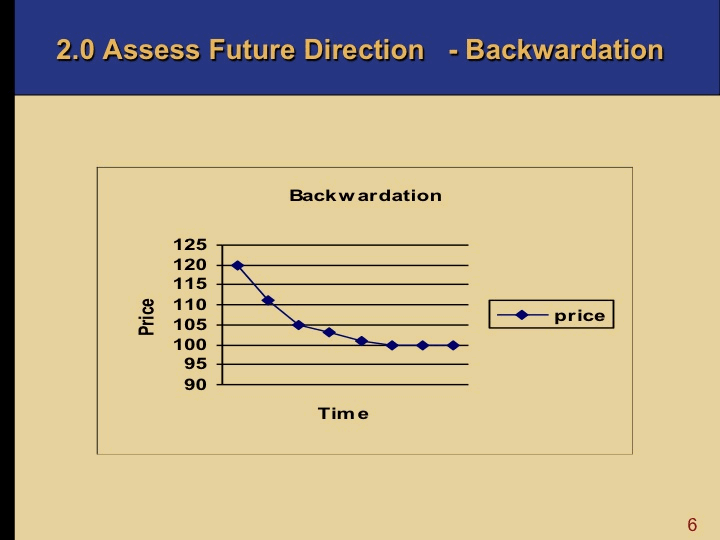
The reverse is true for a market in pure backwardation. As the chart shows, when the prompt price exceeds the futures price, the market is in backwardation. These conditions exist in degrees.
In backwardation, near prices become higher than far prices because:
- consumers prefer to have the product sooner rather than later, and
- traders cannot make an arbitrage profit by selling the spot market and buying back the future.
A market that is steeply backwardated often indicates a perception of a current shortage in the commodity. By the same token, a market that is deeply in contango may indicate a perception of a current supply surplus in the commodity.
There is nothing “normal” about a backwardated market. Backwardation is an incentive not to hold inventory.
Note that when market conditions are in flux, for a time, there may be no clear pattern.
Hedging Instruments
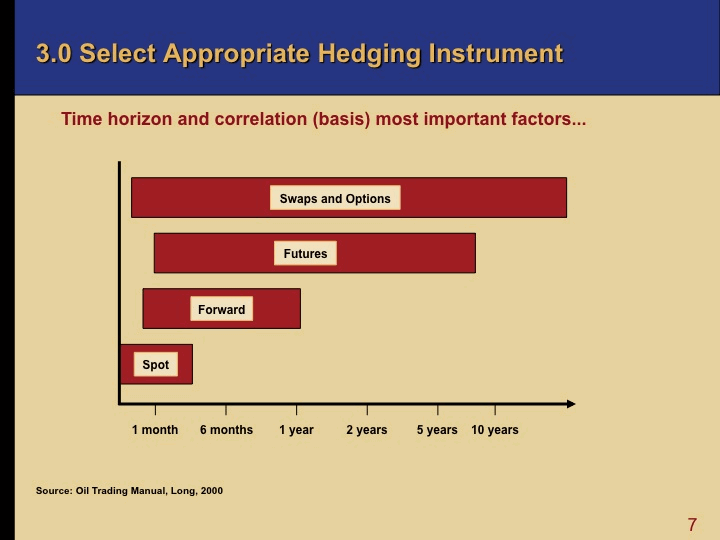
The next process step in the morning supply meeting is to select the appropriate hedging instrument and the most important factors in selecting the instrument are:
- time horizon and
- correlation (basis differences).
Before the introduction of forward and futures contracts, oil companies and traders had no effective means to set prices for future delivery. Today, derivatives have extended the oil market time horizon much further forward, as can be seen in the chart.
The most active futures contracts, such as CME WTI, now trade for delivery up to nine years out. The industry has also developed a new set of OTC swap and option trading instruments that enable participants to establish prices even further into the future.
Execute the Deal
The next process step in the morning supply meeting is to execute the deal – both the physical side and the hedge.
- Close attention is paid to scheduling the physical crude and product movement(s) and make sure that they occur, whether by pipeline or vessel.
- The most common hedging process to execute a standard contract on an exchange, or the ICE trading forum.
Monitor the Deal
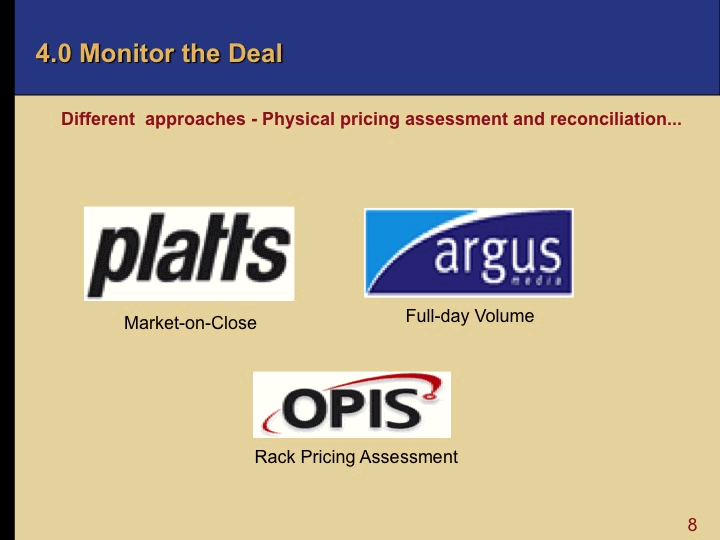
A variety of third party price services are used to monitor the deals.
The pricing, settlement, and reconciliation of physical crude and product deals requires a consistent and transparent pricing and indexing mechanism. Platts and Argus offer different approaches to market pricing methodology. The agreed upon mechanism for pricing and settlement will be stated in the contract of the deal.
- The Platts assessment is called a Market-On-Close (MOC) methodology, which settles the market daily, and is based on deals done during the 30-minute window at the end of the day. Although controversial due to complaints of abuse and manipulation in the window by trading parties, Platts is currently the dominant pricing mechanism in the marketplace.
- Partly in response to perceived inaccuracies in the Platts mechanism, Argus uses a Full-day Volume-weighted assessment to determine daily market index values.
- Another pricing service, called OPIS (Oil Price Information Service) focuses on disseminating up-to-the-minute pricing information on rack-to-retail physical transactions from spot markets throughout the US and Canada. They offer a comprehensive data source for deals at hundreds of delivery points and for all different grades of product
All methods rely heavily on relationships with producers, S&T staff, refiners, traders and brokers to confirm the accuracy of data before publishing their index.
Structure of a Supply and Trading Department
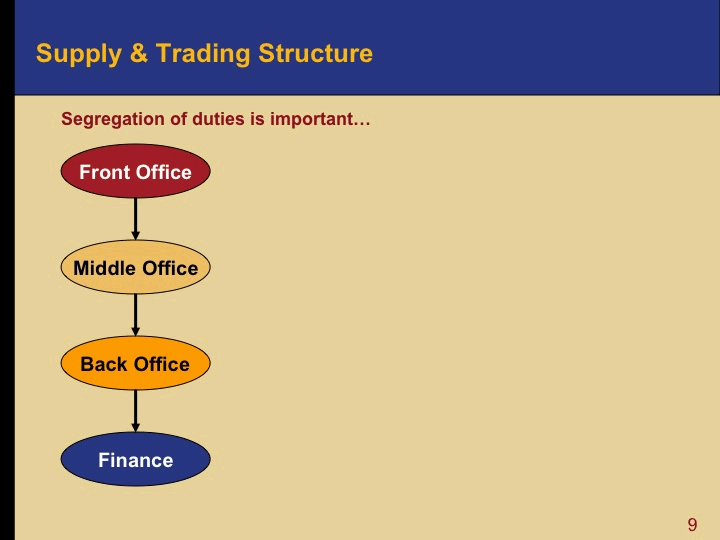
A common term used for the structure of a Supply & Trading Department, and most training operations is Front, Middle and Back Office, as described below:
- The Front Office structures the deals and generates the revenue. Here the traders negotiate deals with a counterparty and enter into contracts for purchase and sale of commodities (or financial instruments). With this initial step the trader has responsibility for ownership of and the risk in the commodity, as well as the accuracy of the way the deal is entered into the computer systems.
- One key role of the Middle Office is to help provided needed controls and measurement of the Front Office. The Middle Office manages the systems that can provide operational and control reports to the traders and the management, etc.
- The Back Office keeps track of the deals as they go through the physical and financial systems. A key back office function is to invoice, collect payments and settle accounts.
A finance function – not part of the core trading operation – provides credit control and recording of transactions in the general ledger.
Deal Flow
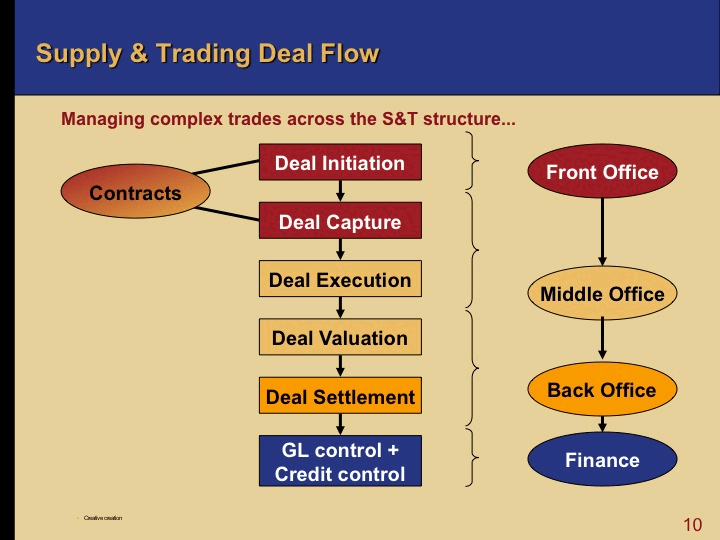
The basic processes in managing the deal flow of a Supply & Trading function are shown in the chart, and described below. Computers are essential to keeping track of this complex activity with thousands of transactions every day in most operations. Numerous providers of trading and risk management software have expertise and products that help manage these processes.
- Deal Initiation involves use of models to help traders analyze deals and price information. Real time price feeds, desktop charting and news feeds are mandatory. More aggressive traders are experimenting with desktop analytic tools that codify the the skill of more talented traders. One of the most common software applications for deal initiation is Instant Messenger communications. Many traders are conducting dozens of simultaneous sessions to make sure they get the best deals.
- Deal Capture & Contracts: Online contract management includes deal approvals and trading limit alarms.
- Deal Execution: In addition to having each deal flow-tracked as it progresses, this process includes scheduling and movements. Inventory management and real-time scheduling systems can help reduce inventory levels as much as 20%-30%.
- Deal Valuation: Online score-keeping systems (including wet, paper and logistics costs) and portfolio management tools are commonly used. The daily measurement of deal performance using mark-to-market reporting is done in this process.
- Settlement: On-line financial accounting can also provide an advantage in efficient trading operations.
Organizational Structure
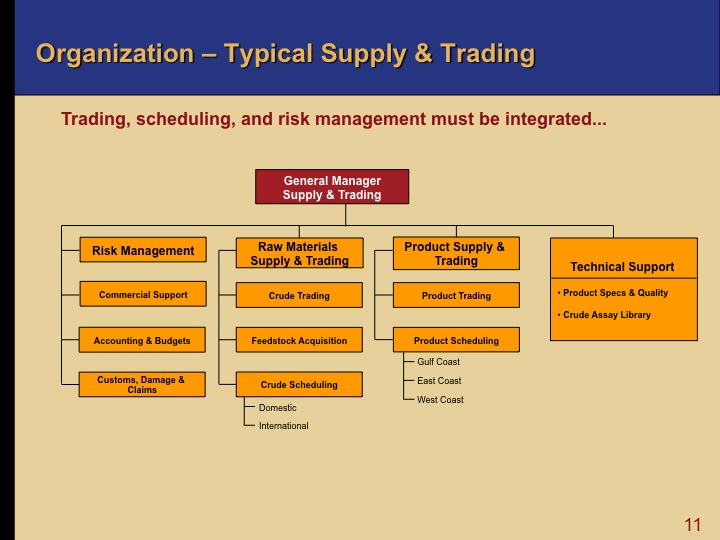
Effective Supply & Trading depends on tightly integrated organizational structures. The traditional functional organization is also ineffective for identifying, understanding, and managing risk.
